Home |
MVL Joint website |
Discussion forum |
Syllabus
A Quick Tour of Visualization and Modeling
This is a quick tour through a variety of visualization and modeling tools that demonstrate some of the affordances of visualization and modeling for learning. This list is not exhaustive by any means; one of the goals of this seminar is to develop a broad framework for thinking about the range of affordance of visualization and modeling tools, as well as the challenges educators face to using these tools successfully in classroom settings.
+ Increased resources
- High bandwidth hierarchical interaction
- Parallel perceptual processing
- Offload work from cognition to perception
- Expand working memory
- Expand storage of information
+ Reduced search
- Locality of processing
- High data density
- Spatially indexed addressing
+ Enhanced recognition of patterns
- Recognition, not recall
- Abstraction and aggregation
- Visual schemata for organization
- Value, relationship, trend
+ Perceptual inference
- Visual representations make some problems obvious
- Graphical computations
- Perceptual monitoring
- Manipulable medium
(different affordances of vis)
1. Visualization as external memory
Example: multi-digit multiplication.
                   52
                  x32
                  ---
                  104
                 1560
                 ----
                 1664
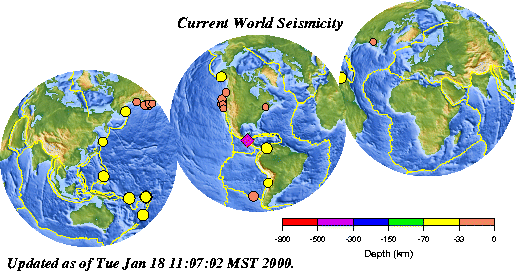
2. Visualization groups related information spatially
Example: mapping earthquakes.
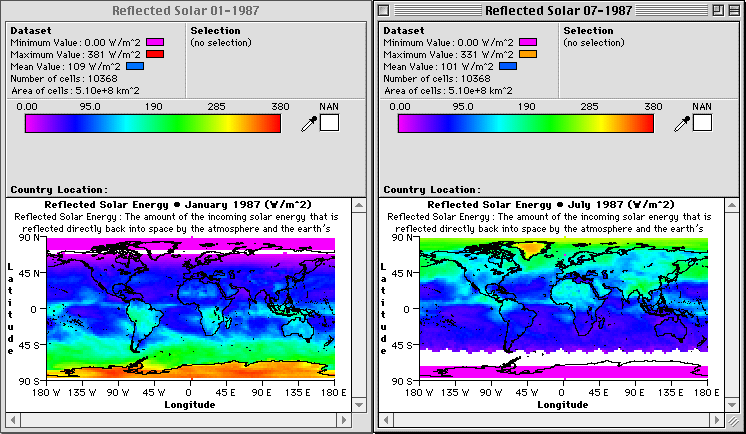
3. Visual perception may reveal patterns not easily seen otherwise
Example: WorldWatcher displays of solar reflection
4. Visualizations may show change over time
Example: Heat Bars from Computers, Teachers, Peers.
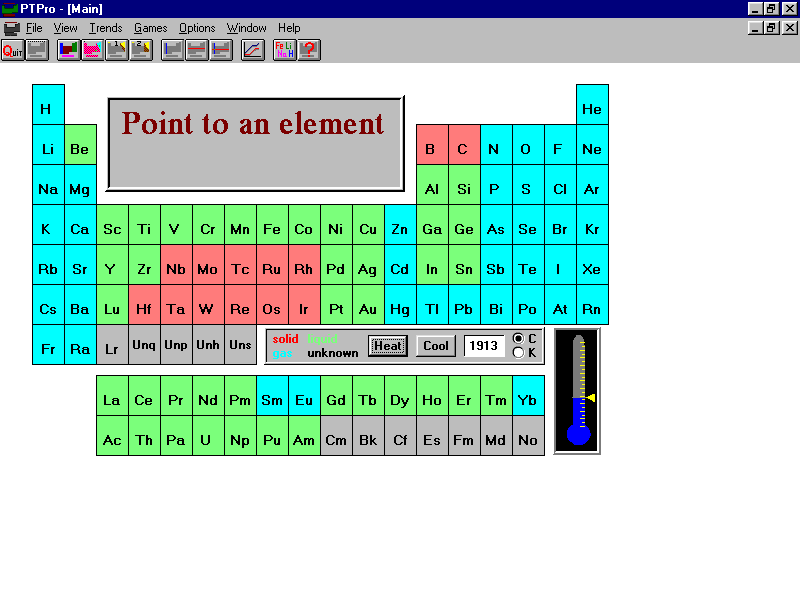
5. Visualizations may be manipulated
Example: dynamic periodic table
6. Simulation environments are highly interactive and model the properties and causal mechanisms of specific domains
Example: Interactive Physics
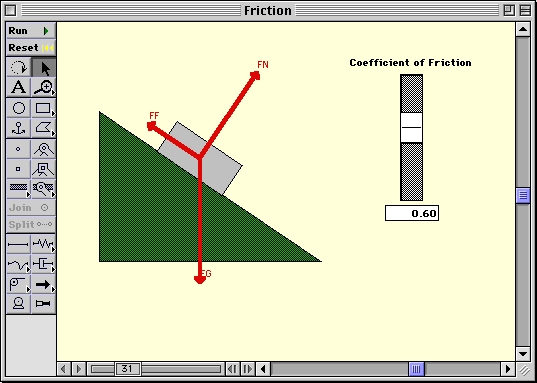
7. General purpose modeling environments allow users to define properties and observe emergent behavior
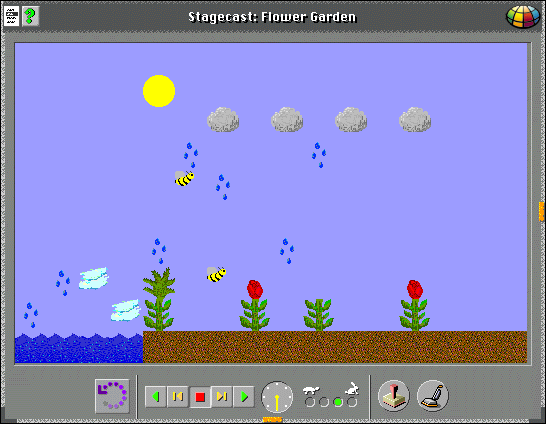
Example: Stagecast Creator
